Tag Archives: NMS

Integration of pmacct with ElasticSearch and Kibana

In this post I want to show a solution based on a script (pmacct-to-elasticsearch) that I made to gather data from pmacct and visualize them using Kibana/ElasticSearch. It’s far from being the state of the art of IP accounting solutions, but it may be used as a starting point for further customizations and developments.

I plan to write another post with some ideas to integrate pmacct with the canonical ELK stack (ElasticSearch/Logstash/Kibana). As usual, add my RSS feed to your reader or follow me on Twitter to stay updated!

The big picture

This is the big picture of the proposed solution:

pmacct-to-elasticsearch - The big picture

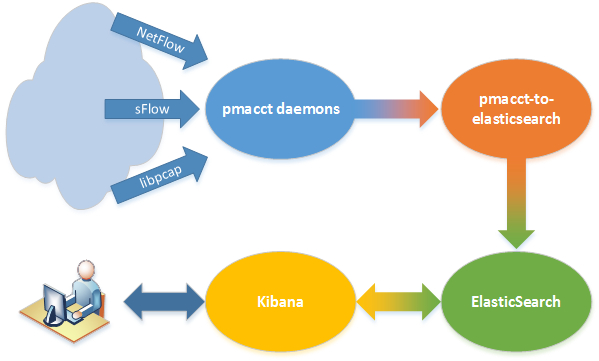
There are 4 main actors: pmacct daemons (we already saw how to install and configure them) that collect accounting data, pmacct-to-elasticsearch, which reads pmacct’s output, processes it and sends it to ElasticSearch, where data are stored and organized into indices and, at last, Kibana, that is used to chart them on a web frontend.

Read more …

Installing pmacct on a fresh Ubuntu setup

This is a simple, quick-and-dirty, copy/paste guide to install a great software, pmacct, on a fresh Ubuntu 14.04.1 LTS (Trusty Tahr) setup. I’ll use this simple setup as the basis for other related posts I plan to publish soon.

pmacct

Tl;dr: pmacct is a suite of tools to collect, filter and aggregate IP accounting data, which works with live traffic (libpcap), NetFlow v1/v5/v7/v8/v9, IPFIX, sFlow and ULOG.

A blog post is not enough to show the great features and possibilities that this tool offers, so I really recommend whoever may be interested to read author’s documentation on the official web site.

On a next post I plan to show some ideas to deploy pmacct together with ElasticSearch and Kibana, in order to build useful dashboards full of graphs. Add my RSS feed to your reader or follow me on Twitter to stay updated!

EDIT: the Integration of pmacct with ElasticSearch and Kibana post has been published.

Let’s start from a really simple setup here.

Read more …

Graphing near realtime PPPoE/PPPoA link speed using SNMP Traffic Grapher (STG to its friends)

Sometimes it happens to me that, for troubleshooting reasons, I need to graph PPPoE or PPPoA connections speed from the NAS/BRAS side. These links are terminated on Cisco routers, where other hundreds of CPEs are connected; connections are from dialin users and I can’t have static graphs, mostly because I don’t need endusers monitoring on a fulltime basis and it would only be a huge waste of resources.

In this case a little program helps me: STG, SNMPTrafficGrapher.

STG - SNMPTrafficGrapher

STG – SNMPTrafficGrapher

It’s a small Windows utility that uses SNMP to get counters data and put them on a graph, like MRTG does. It’s easy and fast to deploy (run it, set SNMP OID and it’s ready), does not use many resources and can give you graphs updated every second.

Configuration

From the View / Settings menu you just have to set the device’s IP address and SNMP community, and then to select OID and polling frequency.

As said, users have dialin connections which go up and down and there is no way to predict their SNMP interface’s index; to obtain the right OID we can use the show snmp mib ifmib ifindex command.

Initially we get the actual Virtual-Access interface for the user we need to monitor:

Router#sh users | include MyUserName
  Vi1.195      MyUserName	   PPPoATM      -        10.11.12.13

Then we get it’s SNMP index:

Router#show snmp mib ifmib ifindex Virtual-Access 1.195
Interface = Virtual-Access1.195, Ifindex = 257

And finally we can use it to configure STG:

STG setup

Geen OID = 1.3.6.1.2.1.2.2.1.10.257 (ifInOctets.257)
Blue OID = 1.3.6.1.2.1.2.2.1.16.257 (ifOutOctets.257)

Where 257 is the dynamic SNMP ifIndex of our user’s Virtual-Access interface.

References

STG homepage: http://leonidvm.chat.ru/

Zabbix: monitoring HSRP on Cisco devices

On the basis of my previous post Cisco HSRP monitoring using SNMP I decided to extend the Zabbix lightweight dynamic template for SNMP routers by adding a new template, which uses part of the configuration already seen in order to monitor Cisco HSRP status. Here it is: Template_Cisco_HSRPGroup.

What we need is to have a trigger fired when a device changes its HSRP state on the LAN side; with the right configuration it may help to understand when something goes wrong on the WAN side.

As seen on the Cisco HSRP monitoring using SNMP post we need two parameters: SNMP interface ID and HSRP group. We already have the first, because each monitored host has the macro used by the Template_Lightweight_Dynamic_SNMPv2_Router: {$LAN_IF_IDX}. We just have to add a new macro to the host, {$HSRP_GROUP}, where we’ll put the HSRP group number used in the router’s configuration, and use it in the new template’s items:

Description: HSRP Group {$HSRP_GROUP} state
SNMP OID: .1.3.6.1.4.1.9.9.106.1.2.1.1.15.{$LAN_IF_IDX}.{$HSRP_GROUP}
SNMP community: public
Key: cHsrpGrpStandbyState

Description: HSRP Group {$HSRP_GROUP} active IP
SNMP OID: .1.3.6.1.4.1.9.9.106.1.2.1.1.13.{$LAN_IF_IDX}.{$HSRP_GROUP}
SNMP community: public
Key: cHsrpGrpActiveRouter

Description: HSRP Group {$HSRP_GROUP} standby IP
SNMP OID: .1.3.6.1.4.1.9.9.106.1.2.1.1.14.{$LAN_IF_IDX}.{$HSRP_GROUP}
SNMP community: public
Key: cHsrpGrpStandbyRouter

At this point we add 3 more macros to tell Zabbix which values we expect to find for the HSRP group state, active IP and standby IP: {$HSRP_GROUP_EXPECTED_STATE}, {$HSRP_GROUP_EXPECTED_ACTIVE_IP} and {$HSRP_GROUP_EXPECTED_STANDBY_IP}.

Here are the host macros used by Template_Lightweight_Dynamic_SNMPv2_Router and by the new Template_Cisco_HSRPGroup:

Simple triggers will notice unexpected behaviour:

Name: Unexpected HSRP group state
Expression: {Template_Cisco_HSRPGroup:cHsrpGrpStandbyState.last(0)}#{$HSRP_GROUP_EXPECTED_STATE}
Severity: High

Name: Unexpected HSRP active router
Expression: {Template_Cisco_HSRPGroup:cHsrpGrpActiveRouter.str("{$HSRP_GROUP_EXPECTED_ACTIVE_IP}")}=0
Severity: High

...

Here you can find the XML Template: Template_Cisco_HSRPGroup.zip

Cisco HSRP monitoring using SNMP

Cisco HSRP MIB is defined in CISCO-HSRP-MIB and CISCO-HSRP-EXT-MIB; for a basic SNMP monitoring the first MIB is more than enough.

The most important table in order to get HSRP status information is cHsrpGrpTable, where we can find as many cHsrpGrpEntry objects as HSRP groups configured in the router. Each cHsrpGrpEntry object represents the HSRP configuration and status for a given HSRP group number on a given interface; it has, so, a double index: SNMP interface ID and HSRP group number.

Here is an example of a snmpwalk over a router:

root@NMS:~# snmpwalk -v 2c -c public 10.0.0.1 .1.3.6.1.4.1.9.9.106.1.2.1.1
iso.3.6.1.4.1.9.9.106.1.2.1.1.2.2.10 = STRING: "cisco"
iso.3.6.1.4.1.9.9.106.1.2.1.1.3.2.10 = Gauge32: 255
iso.3.6.1.4.1.9.9.106.1.2.1.1.4.2.10 = INTEGER: 1
iso.3.6.1.4.1.9.9.106.1.2.1.1.5.2.10 = Gauge32: 0
iso.3.6.1.4.1.9.9.106.1.2.1.1.6.2.10 = INTEGER: 2
iso.3.6.1.4.1.9.9.106.1.2.1.1.7.2.10 = Gauge32: 0
iso.3.6.1.4.1.9.9.106.1.2.1.1.8.2.10 = Gauge32: 0
iso.3.6.1.4.1.9.9.106.1.2.1.1.9.2.10 = Gauge32: 3000
iso.3.6.1.4.1.9.9.106.1.2.1.1.10.2.10 = Gauge32: 10000
iso.3.6.1.4.1.9.9.106.1.2.1.1.11.2.10 = IpAddress: 10.0.0.254
iso.3.6.1.4.1.9.9.106.1.2.1.1.12.2.10 = INTEGER: 1
iso.3.6.1.4.1.9.9.106.1.2.1.1.13.2.10 = IpAddress: 10.0.0.1
iso.3.6.1.4.1.9.9.106.1.2.1.1.14.2.10 = IpAddress: 10.0.0.2
iso.3.6.1.4.1.9.9.106.1.2.1.1.15.2.10 = INTEGER: 6
iso.3.6.1.4.1.9.9.106.1.2.1.1.16.2.10 = Hex-STRING: 00 00 0C 07 AC 0A
iso.3.6.1.4.1.9.9.106.1.2.1.1.17.2.10 = INTEGER: 1

The first highlighted value is the SNMP interface ID: you can get the SNMP ID for a given interface using the show snmp mib ifmib ifindex command:

CiscoRouter#show snmp mib ifmib ifindex FastEthernet 0/1
Interface = GigabitEthernet0/1, Ifindex = 2.

The second highlighted value is the HSRP group, the one you use while configuring HSRP:

interface FastEthernet0/1
 standby 10 ip 10.0.0.254
 standby 10 priority 255
 ...

In order to monitor the HSRP group state you just have to grab the cHsrpGrpStandbyState parameter (OID iso.3.6.1.4.1.9.9.106.1.2.1.1.15.2.10), which can have one of the following values:

1: initial
2: learn
3: listen
4: speak
5: standby
6: active

In my previous example the router was in the active state.

References

Cisco.com: Hot Standby Router Protocol Features and Functionality

Cisco.com: CISCO-HSRP-MIB

Cisco.com: CISCO-HSRP-EXT-MIB

Wikipedia: HSRP