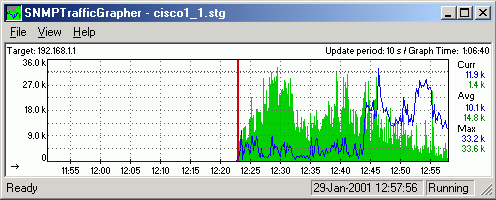
Sometimes it happens to me that, for troubleshooting reasons, I need to graph PPPoE or PPPoA connections speed from the NAS/BRAS side. These links are terminated on Cisco routers, where other hundreds of CPEs are connected; connections are from dialin users and I can’t have static graphs, mostly because I don’t need endusers monitoring on a fulltime basis and it would only be a huge waste of resources.
In this case a little program helps me: STG, SNMPTrafficGrapher.
It’s a small Windows utility that uses SNMP to get counters data and put them on a graph, like MRTG does. It’s easy and fast to deploy (run it, set SNMP OID and it’s ready), does not use many resources and can give you graphs updated every second.
Configuration
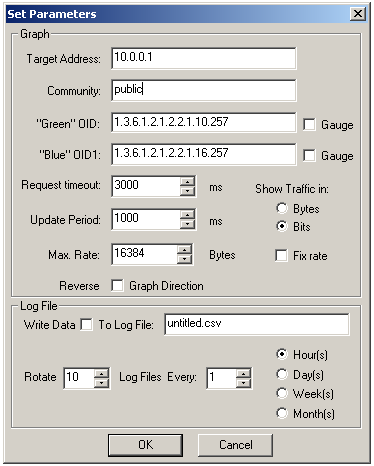
From the View / Settings menu you just have to set the device’s IP address and SNMP community, and then to select OID and polling frequency.
As said, users have dialin connections which go up and down and there is no way to predict their SNMP interface’s index; to obtain the right OID we can use the show snmp mib ifmib ifindex command.
Initially we get the actual Virtual-Access interface for the user we need to monitor:
Router#sh users | include MyUserName
  Vi1.195      MyUserName	   PPPoATM      -        10.11.12.13
Then we get it’s SNMP index:
Router#show snmp mib ifmib ifindex Virtual-Access 1.195
Interface = Virtual-Access1.195, Ifindex = 257
And finally we can use it to configure STG:
Geen OID = 1.3.6.1.2.1.2.2.1.10.257 (ifInOctets.257)
Blue OID = 1.3.6.1.2.1.2.2.1.16.257 (ifOutOctets.257)
Where 257 is the dynamic SNMP ifIndex of our user’s Virtual-Access interface.
References
STG homepage: http://leonidvm.chat.ru/
Latest posts by Pier Carlo Chiodi (see all)
- Good MANRS for IXPs route servers made easier - 11 December 2020
- Route server feature-rich and automatic configuration - 13 February 2017
- Large BGP Communities playground - 15 September 2016

