Category Archives: Systems Administration

Windows Server 2008 / IIS 7.5: client source port logging

Many countermeasures taken by ISPs to face IPv4 exhaustion (DS-Lite, NAT64, NAT44, CGN) need more than the old IP-address/timestamp couple to uniquely identify an end-user on Internet. Even with a full logging of activities and sessions an ISP can’t trace a specific user if no source TCP/UDP port is given. So content providers, whether large or small, need to enable clients source port logging; it doesn’t matter if they run an enormous e-commerce website or a small blog like this, if they want to provide Law Enforcement Agencies (LEAs) a set of information capable of uniquely trace a user they need client source port logging.

Many software products have simple builtin configuration commands to accomplish this task, here I write how to enable this feature under Microsoft Windows Server 2008 R2 – IIS 7.5.

Advanced Logging IIS extension

The IIS builtin logging module doesn’t allow client source port logging, so an extension is needed: Advanced Logging. Once installed a new icon appears in the IIS Management Console:

IIS Advanced Logging icon

IIS Advanced Logging icon

Enable client port logging

Configuration can be done at any level: global, web site, directory. Open the Advanced Logging icon then, in the Actions pane, click Enable Advanced Logging. Once enabled the feature you just need to add the client port to the list of logged fields: always from the Action pane click Edit Logging Fields, then the Add field button and use the following data:

Field ID: Client-IP
Source type: Server variables
Source name: REMOTE_PORT

Hit the OK button a couple of time and go back to the main window, where you find the default log definition named %COMPUTERNAME%-Server; double click it in order to open details then select your logging preferences, being careful to add the Client-IP field ID to the list of the selected ones (from the Selected Fields section click the Select Fields button and check it).

After you have done some activity on your web site you can check the log content clicking View log files from the Actions pane; client port will be there somewhere, depending on the fields sequence you have on the log definition Selected Fields list.

LVM: disable udev sync to avoid “udevd timeout: killing watershed” error

While I was working on the setup of a simple cluster with LVM running on top of DRBD and managed by Pacemaker/Corosync I had a problem with LVM resources not coming up after a reboot.

The cluster was running on Ubuntu 12.04 (3.5.0-36 kernel), LVM logical volumes were used for data storage only (mapped to iSCSI target LUNs) while the whole system was running on physical disks.

The message logged by the Heartbeat OCF resource agent was “ERROR: LVM: MyVolumeGroup did not activate correctly” and the cluster status stuck in this way:

Resource Group: MyCluster
     LVM_Group     (ocf::heartbeat:LVM):   Started MYHOSTNAME (unmanaged) FAILED

To manually resolve the situation I had to deactivate volume groups and restart the cluster manager every time:

MYHOSTNAME:~# vgchange -a n 
MYHOSTNAME:~# service corosync restart

Further logs investigation led me to find some udevd errors:

udevd[2083]: timeout: killing 'watershed sh -c '/sbin/lvm vgscan; /sbin/lvm vgchange -a y'' [4934]
 udevd[2083]: 'watershed sh -c '/sbin/lvm vgscan; /sbin/lvm vgchange -a y'' [4934] terminated by signal 9 (Killed)

Something was going wrong in the LVM/udev synchronisation, resulting in the deadlock or failure of resource manager, so I decided to bypass it by setting udev_sync parameter to 0 (zero) in the /etc/lvm/lvm.conf:

[...]
    activation {
    udev_sync = 0   # please read further - do it at your own risk
    [...]
}

This solution worked very well, LVM resources started coming up in the proper way after reboot and, still now, they are up & running and fully manageable by Pacemaker.

A couple of searches on the web showed me Ubuntu Bug #995645, that could be somehow related to my case. Of course, if LVM had been used for system storage many other problems could arise due to the lack of sync with udev, but that was not my case.

At the time of writing the bug is still confirmed but unassigned.

DNS-amplification attack reflection on backhaul circuit

As many of us already know, DNS amplification attacks are a big plague for who fights every day for the sake of Internet security and service availability.

Infected hosts are instructed by botnet controllers to send DNS queries to recursive open resolvers, asking them for big zones with spoofed UDP packets containing the victim’s IP address in the source field, so that a small request would generate a big traffic toward the victim.

Small efforts are needed in order to mitigate those attacks – a proper DNS resolvers configuration to avoid open recursion, IP source validation (such as Cisco uRPF) to block source IP spoofing at the access network layer – but they may not be sufficient to immunize a network against annoying issues.

An unpleasant side effect

Even on secure networks an unpleasant side effect may occur: attack reflection against infected hosts, with the consequent backhaul circuit saturation and users’ downstream degradation.

Take, for example, the following not uncommon scenario:

DNS Amplification Reflection - Scenario

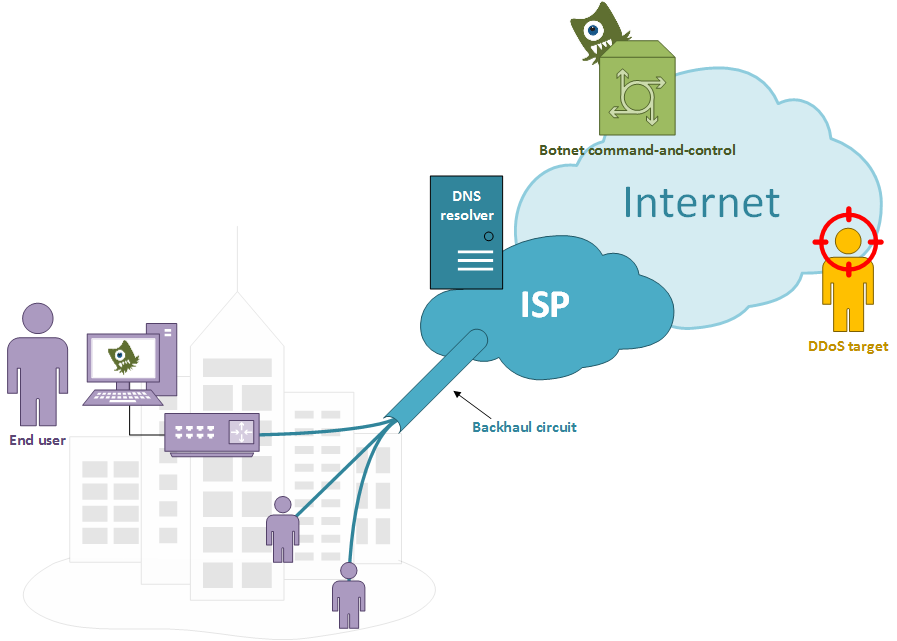
An ISP, running a properly configured DNS resolver, connects many users with a shared backhaul link between its core network and a local metro area; one or more users have infected devices responding to a botnet C&C server who aims to launch a DDoS against a given target.

A well implemented network access layer would stop spoofed packets whose source IP can not be reached through the same link on which they came from. At the same time a properly configured DNS resolver would not let recursive queries to go on by untrusted sources. The problem raises when proper DNS queries came in from trusted users and go to the ISP DNS resolver.

A not-really-failed attack attempt

Failed Attack

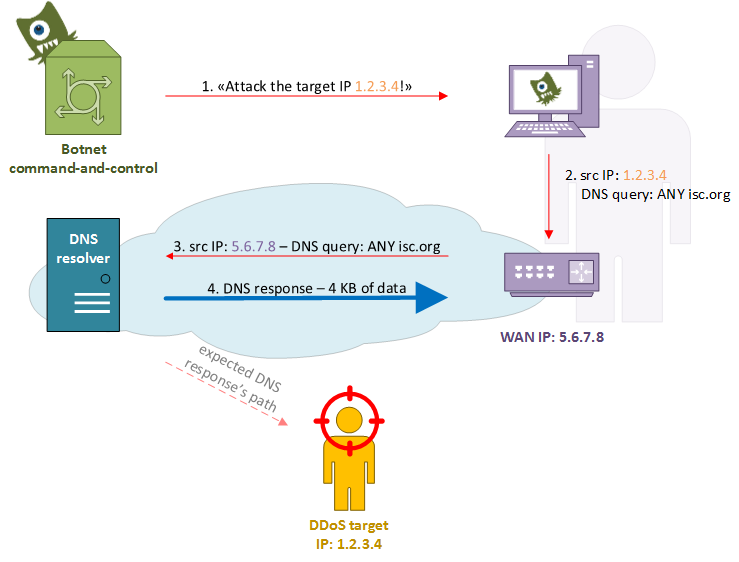
In the above diagram, at step 1, the botnet controller instructs the infected host to start a DNS amplification attack against the victim’s IP address 1.2.3.4. In the step 2 the malicious software tries to send a spoofed packet containing the victim’s address in the source field but something goes wrong: the operating system doesn’t let the malware to forge such a packet and rewrites it using its LAN address, or the router/firewall/CPE changes it with the WAN IP address (NAT). Anyway, at step 3, a proper DNS query comes out the user’s network and heads to the ISP DNS resolver, which in turn sends back a response with the huge DNS zone (step 4).

It’s easy to understand how this behaviour could lead to ISP internal issues regarding the backhaul link saturation and the users experience’s deterioration.

Consequences

A small upstream user’s query (65 bytes for an ANY query on isc.org) produces a big downstream response (~ 4 KB for isc.org zone), with a ~ 60x multiplicative factor. Every infected host may send many and many queries over a long period, even more than 1 query per second for many days, and many compromised hosts may be triggered at the same time by the same botnet controller.

Backhaul links may be rent from incumbent local carriers and may be characterized by an overbooking ratio calculated over the expected usage by customers who share them; high speed links which connect DNS resolvers to the core may overwhelm them when filled by UDP response packets and lead to traffic stagnation because of traffic policing operated by the carrier.

Customers also may report a bad user experience: it’s true, their links are operating at 100% of their capacity, but Facebook is slow and the VoIP is unusable.

A very big headache, even for an ISP with a properly configured network.

Symptoms

The first symptom that can be observed is an abnormal peak in resolvers bandwidth usage:

DNS resolver bandwidth usage during an attack attempt - response traffic in green

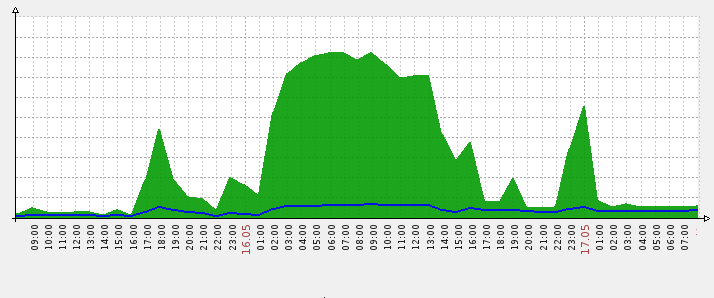
DNS resolver bandwidth usage during an attack attempt – response traffic in green

During an attack attempt the network usage (servers’ upstream) may raise up to hundreds of times higher than average.

NetFlow also may help us to identify this kind of traffic; big response UDP datagrams may be fragmented over the network and they would be shown as port-0 UDP packets in the output of nfdump or similar tools, with an high Bpp (bytes-per-packet) ratio:

Proto Src IP Addr:Port  Dst IP Addr:Port   Packets    Bytes  pps     bps   Bpp Flows
UDP    RESOLVER_1:0   ->  A.B.1.155:0        78966  106.6 M   48  519300  1350    79
UDP    RESOLVER_1:0   ->   G.H.4.73:0        35798   48.3 M   25  274100  1350    38
UDP    RESOLVER_1:53  ->  I.J.5.101:14068     7430    9.3 M    4   46712  1249   187
A 65-bytes request generated a 4157 bytes response in 3 segments - calculated at IP level

A 65-bytes request generated a 4157 bytes response in 3 segments – calculated at IP level

Mitigation

Unfortunately, as far as I know, there are still no specific implementations aimed to mitigate those kind of attack.

BIND9 has a generic rate-limit option which prevents a requestor to be told the same answer more than a specific number of times within a one-second interval, but there is no way to apply it only to a subset of responses (like the ones used in DDoS attack, such as ANY to isc.org or ripe.net). DNS RRL (Response Rate Limiting) is focused on authoritative servers, not on recursive ones.

A suitable way would be the use of the iptables recent module on recursive resolvers, but other aspects have to be considered, such as servers load and performances degradation.
A first deep-packet inspection of the incoming DNS requests would filter those DNS queries whose type has been set to ANY, then the recent module would lookup the source IP address on a local list and drop the packet if it violates the predetermined policy. For example, a policy may allow one or two queries with type = ANY every 5 seconds, so that “regular” usage would be allowed while malware initiated traffic would be dropped within few seconds.

Number of different IP addresses on the recent module's queue - peak during an attack attemp

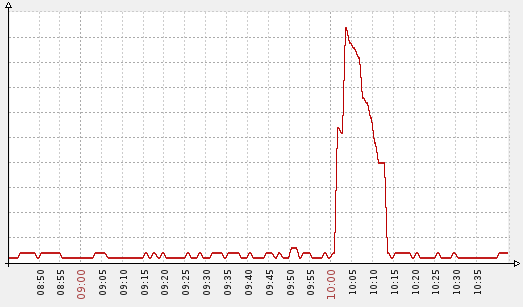
Number of different IP addresses on the recent module’s queue – peak during an attack attemp

References

“Alert (TA13-088A) DNS Amplification Attacks”, US-Cert: http://www.us-cert.gov/ncas/alerts/TA13-088A

“DNS Response Rate Limiting (DNS RRL)”, Paul Vixie, ISC – Vernon Schryver, Rhyolite: http://ss.vix.su/~vixie/isc-tn-2012-1.txt

Apache2 SSL certificates signed by the Windows domain Certification Authority

This is mostly a reminder to myself…

When you submit an openssl generated certificate signing request (CSR) file to a Windows Certification Authority and try to sign it you receive the following error:

The request contains no certificate template information. The request does not contain a certificate template extension or the CertificateTemplate request attribute.

The request contains no certificate template information. The request does not contain a certificate template extension or the CertificateTemplate request attribute.

CA signing error – The request contains no certificate template information.

Every time (not really “every”!) I need to setup an Apache2 SSL certificate I get stuck in front of it!

Steps to have a domain-trusted SSL certificate installed on Apache2

1) Generate an SSL certificate signing request (CSR):

openssl req -new -newkey rsa:2048 -nodes -keyout server.key -out server.csr

2) Move the CSR file on the Windows server where the Certification Authority is running.

3) Open a DOS prompt with administrative privileges and run the following command:

certreq -submit -attrib "certificatetemplate:WebServer"

4) Now select the CSR file and then choose where to save the X.509 file.

You got it!

The WebServer name used in the certreq command is the name of the template you want to use, not the “display name”; you can have this parameter from the “Certificate Templates Console” MMC snap-in (certtmpl.msc):

Template name from the Certificate Templates Console

Template name from the Certificate Templates Console

Zabbix: monitoring HSRP on Cisco devices

On the basis of my previous post Cisco HSRP monitoring using SNMP I decided to extend the Zabbix lightweight dynamic template for SNMP routers by adding a new template, which uses part of the configuration already seen in order to monitor Cisco HSRP status. Here it is: Template_Cisco_HSRPGroup.

What we need is to have a trigger fired when a device changes its HSRP state on the LAN side; with the right configuration it may help to understand when something goes wrong on the WAN side.

As seen on the Cisco HSRP monitoring using SNMP post we need two parameters: SNMP interface ID and HSRP group. We already have the first, because each monitored host has the macro used by the Template_Lightweight_Dynamic_SNMPv2_Router: {$LAN_IF_IDX}. We just have to add a new macro to the host, {$HSRP_GROUP}, where we’ll put the HSRP group number used in the router’s configuration, and use it in the new template’s items:

Description: HSRP Group {$HSRP_GROUP} state
SNMP OID: .1.3.6.1.4.1.9.9.106.1.2.1.1.15.{$LAN_IF_IDX}.{$HSRP_GROUP}
SNMP community: public
Key: cHsrpGrpStandbyState

Description: HSRP Group {$HSRP_GROUP} active IP
SNMP OID: .1.3.6.1.4.1.9.9.106.1.2.1.1.13.{$LAN_IF_IDX}.{$HSRP_GROUP}
SNMP community: public
Key: cHsrpGrpActiveRouter

Description: HSRP Group {$HSRP_GROUP} standby IP
SNMP OID: .1.3.6.1.4.1.9.9.106.1.2.1.1.14.{$LAN_IF_IDX}.{$HSRP_GROUP}
SNMP community: public
Key: cHsrpGrpStandbyRouter

At this point we add 3 more macros to tell Zabbix which values we expect to find for the HSRP group state, active IP and standby IP: {$HSRP_GROUP_EXPECTED_STATE}, {$HSRP_GROUP_EXPECTED_ACTIVE_IP} and {$HSRP_GROUP_EXPECTED_STANDBY_IP}.

Here are the host macros used by Template_Lightweight_Dynamic_SNMPv2_Router and by the new Template_Cisco_HSRPGroup:

Simple triggers will notice unexpected behaviour:

Name: Unexpected HSRP group state
Expression: {Template_Cisco_HSRPGroup:cHsrpGrpStandbyState.last(0)}#{$HSRP_GROUP_EXPECTED_STATE}
Severity: High

Name: Unexpected HSRP active router
Expression: {Template_Cisco_HSRPGroup:cHsrpGrpActiveRouter.str("{$HSRP_GROUP_EXPECTED_ACTIVE_IP}")}=0
Severity: High

...

Here you can find the XML Template: Template_Cisco_HSRPGroup.zip