Apache2 SSL certificates signed by the Windows domain Certification Authority

This is mostly a reminder to myself…

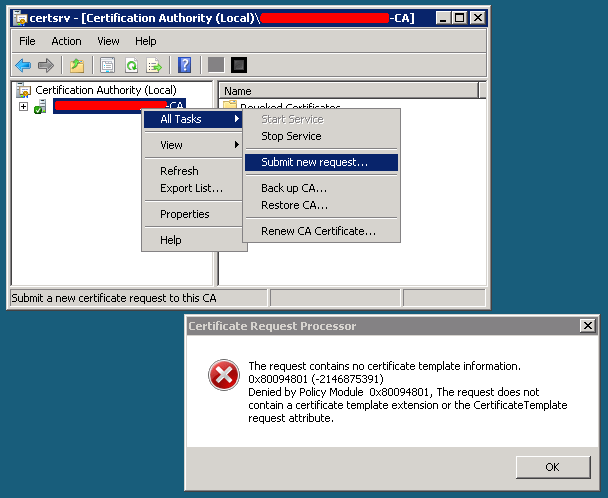
When you submit an openssl generated certificate signing request (CSR) file to a Windows Certification Authority and try to sign it you receive the following error:

The request contains no certificate template information. The request does not contain a certificate template extension or the CertificateTemplate request attribute.

The request contains no certificate template information. The request does not contain a certificate template extension or the CertificateTemplate request attribute.

CA signing error – The request contains no certificate template information.

Every time (not really “every”!) I need to setup an Apache2 SSL certificate I get stuck in front of it!

Steps to have a domain-trusted SSL certificate installed on Apache2

1) Generate an SSL certificate signing request (CSR):

openssl req -new -newkey rsa:2048 -nodes -keyout server.key -out server.csr

2) Move the CSR file on the Windows server where the Certification Authority is running.

3) Open a DOS prompt with administrative privileges and run the following command:

certreq -submit -attrib "certificatetemplate:WebServer"

4) Now select the CSR file and then choose where to save the X.509 file.

You got it!

The WebServer name used in the certreq command is the name of the template you want to use, not the “display name”; you can have this parameter from the “Certificate Templates Console” MMC snap-in (certtmpl.msc):
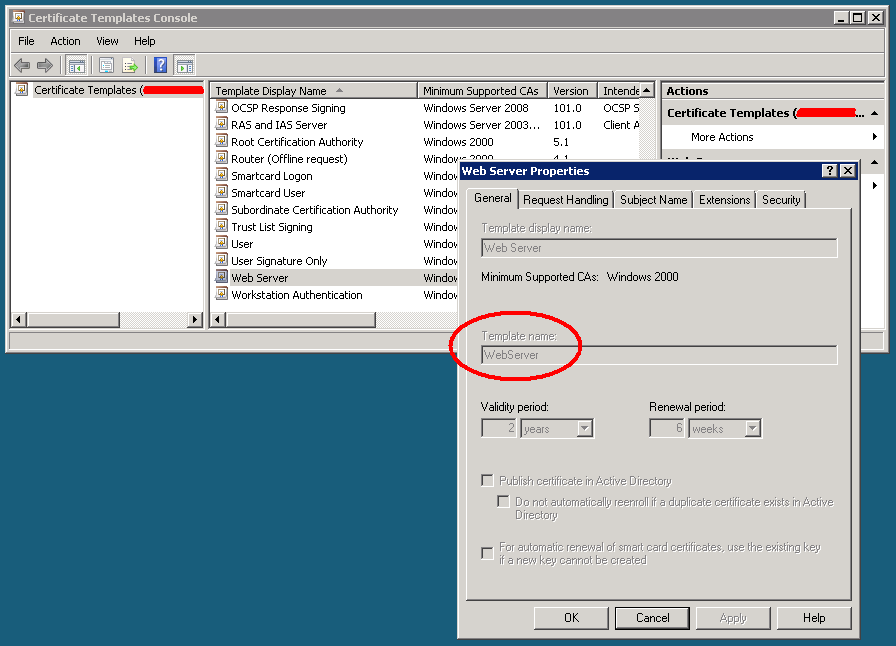
Template name from the Certificate Templates Console

Template name from the Certificate Templates Console

Graphing near realtime PPPoE/PPPoA link speed using SNMP Traffic Grapher (STG to its friends)

Sometimes it happens to me that, for troubleshooting reasons, I need to graph PPPoE or PPPoA connections speed from the NAS/BRAS side. These links are terminated on Cisco routers, where other hundreds of CPEs are connected; connections are from dialin users and I can’t have static graphs, mostly because I don’t need endusers monitoring on a fulltime basis and it would only be a huge waste of resources.

In this case a little program helps me: STG, SNMPTrafficGrapher.

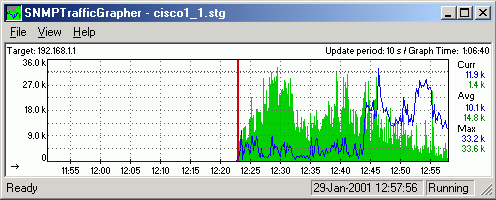
STG - SNMPTrafficGrapher

STG – SNMPTrafficGrapher

It’s a small Windows utility that uses SNMP to get counters data and put them on a graph, like MRTG does. It’s easy and fast to deploy (run it, set SNMP OID and it’s ready), does not use many resources and can give you graphs updated every second.

Configuration

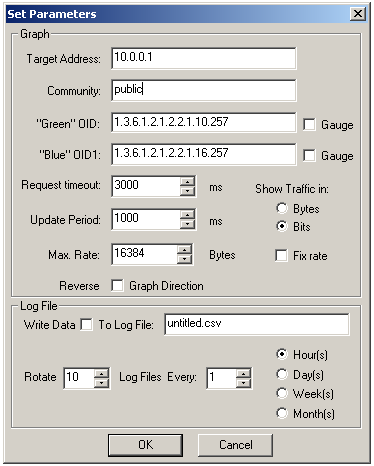
From the View / Settings menu you just have to set the device’s IP address and SNMP community, and then to select OID and polling frequency.

As said, users have dialin connections which go up and down and there is no way to predict their SNMP interface’s index; to obtain the right OID we can use the show snmp mib ifmib ifindex command.

Initially we get the actual Virtual-Access interface for the user we need to monitor:

Router#sh users | include MyUserName
  Vi1.195      MyUserName	   PPPoATM      -        10.11.12.13

Then we get it’s SNMP index:

Router#show snmp mib ifmib ifindex Virtual-Access 1.195
Interface = Virtual-Access1.195, Ifindex = 257

And finally we can use it to configure STG:

STG setup

Geen OID = 1.3.6.1.2.1.2.2.1.10.257 (ifInOctets.257)
Blue OID = 1.3.6.1.2.1.2.2.1.16.257 (ifOutOctets.257)

Where 257 is the dynamic SNMP ifIndex of our user’s Virtual-Access interface.

References

STG homepage: http://leonidvm.chat.ru/

Zabbix: monitoring HSRP on Cisco devices

On the basis of my previous post Cisco HSRP monitoring using SNMP I decided to extend the Zabbix lightweight dynamic template for SNMP routers by adding a new template, which uses part of the configuration already seen in order to monitor Cisco HSRP status. Here it is: Template_Cisco_HSRPGroup.

What we need is to have a trigger fired when a device changes its HSRP state on the LAN side; with the right configuration it may help to understand when something goes wrong on the WAN side.

As seen on the Cisco HSRP monitoring using SNMP post we need two parameters: SNMP interface ID and HSRP group. We already have the first, because each monitored host has the macro used by the Template_Lightweight_Dynamic_SNMPv2_Router: {$LAN_IF_IDX}. We just have to add a new macro to the host, {$HSRP_GROUP}, where we’ll put the HSRP group number used in the router’s configuration, and use it in the new template’s items:

Description: HSRP Group {$HSRP_GROUP} state
SNMP OID: .1.3.6.1.4.1.9.9.106.1.2.1.1.15.{$LAN_IF_IDX}.{$HSRP_GROUP}
SNMP community: public
Key: cHsrpGrpStandbyState

Description: HSRP Group {$HSRP_GROUP} active IP
SNMP OID: .1.3.6.1.4.1.9.9.106.1.2.1.1.13.{$LAN_IF_IDX}.{$HSRP_GROUP}
SNMP community: public
Key: cHsrpGrpActiveRouter

Description: HSRP Group {$HSRP_GROUP} standby IP
SNMP OID: .1.3.6.1.4.1.9.9.106.1.2.1.1.14.{$LAN_IF_IDX}.{$HSRP_GROUP}
SNMP community: public
Key: cHsrpGrpStandbyRouter

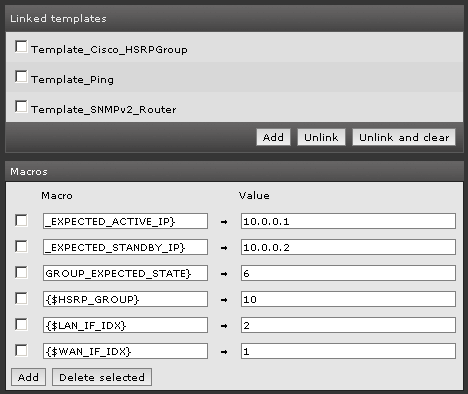
At this point we add 3 more macros to tell Zabbix which values we expect to find for the HSRP group state, active IP and standby IP: {$HSRP_GROUP_EXPECTED_STATE}, {$HSRP_GROUP_EXPECTED_ACTIVE_IP} and {$HSRP_GROUP_EXPECTED_STANDBY_IP}.

Here are the host macros used by Template_Lightweight_Dynamic_SNMPv2_Router and by the new Template_Cisco_HSRPGroup:

Simple triggers will notice unexpected behaviour:

Name: Unexpected HSRP group state
Expression: {Template_Cisco_HSRPGroup:cHsrpGrpStandbyState.last(0)}#{$HSRP_GROUP_EXPECTED_STATE}
Severity: High

Name: Unexpected HSRP active router
Expression: {Template_Cisco_HSRPGroup:cHsrpGrpActiveRouter.str("{$HSRP_GROUP_EXPECTED_ACTIVE_IP}")}=0
Severity: High

...

Here you can find the XML Template: Template_Cisco_HSRPGroup.zip

Cisco HSRP monitoring using SNMP

Cisco HSRP MIB is defined in CISCO-HSRP-MIB and CISCO-HSRP-EXT-MIB; for a basic SNMP monitoring the first MIB is more than enough.

The most important table in order to get HSRP status information is cHsrpGrpTable, where we can find as many cHsrpGrpEntry objects as HSRP groups configured in the router. Each cHsrpGrpEntry object represents the HSRP configuration and status for a given HSRP group number on a given interface; it has, so, a double index: SNMP interface ID and HSRP group number.

Here is an example of a snmpwalk over a router:

root@NMS:~# snmpwalk -v 2c -c public 10.0.0.1 .1.3.6.1.4.1.9.9.106.1.2.1.1
iso.3.6.1.4.1.9.9.106.1.2.1.1.2.2.10 = STRING: "cisco"
iso.3.6.1.4.1.9.9.106.1.2.1.1.3.2.10 = Gauge32: 255
iso.3.6.1.4.1.9.9.106.1.2.1.1.4.2.10 = INTEGER: 1
iso.3.6.1.4.1.9.9.106.1.2.1.1.5.2.10 = Gauge32: 0
iso.3.6.1.4.1.9.9.106.1.2.1.1.6.2.10 = INTEGER: 2
iso.3.6.1.4.1.9.9.106.1.2.1.1.7.2.10 = Gauge32: 0
iso.3.6.1.4.1.9.9.106.1.2.1.1.8.2.10 = Gauge32: 0
iso.3.6.1.4.1.9.9.106.1.2.1.1.9.2.10 = Gauge32: 3000
iso.3.6.1.4.1.9.9.106.1.2.1.1.10.2.10 = Gauge32: 10000
iso.3.6.1.4.1.9.9.106.1.2.1.1.11.2.10 = IpAddress: 10.0.0.254
iso.3.6.1.4.1.9.9.106.1.2.1.1.12.2.10 = INTEGER: 1
iso.3.6.1.4.1.9.9.106.1.2.1.1.13.2.10 = IpAddress: 10.0.0.1
iso.3.6.1.4.1.9.9.106.1.2.1.1.14.2.10 = IpAddress: 10.0.0.2
iso.3.6.1.4.1.9.9.106.1.2.1.1.15.2.10 = INTEGER: 6
iso.3.6.1.4.1.9.9.106.1.2.1.1.16.2.10 = Hex-STRING: 00 00 0C 07 AC 0A
iso.3.6.1.4.1.9.9.106.1.2.1.1.17.2.10 = INTEGER: 1

The first highlighted value is the SNMP interface ID: you can get the SNMP ID for a given interface using the show snmp mib ifmib ifindex command:

CiscoRouter#show snmp mib ifmib ifindex FastEthernet 0/1
Interface = GigabitEthernet0/1, Ifindex = 2.

The second highlighted value is the HSRP group, the one you use while configuring HSRP:

interface FastEthernet0/1
 standby 10 ip 10.0.0.254
 standby 10 priority 255
 ...

In order to monitor the HSRP group state you just have to grab the cHsrpGrpStandbyState parameter (OID iso.3.6.1.4.1.9.9.106.1.2.1.1.15.2.10), which can have one of the following values:

1: initial
2: learn
3: listen
4: speak
5: standby
6: active

In my previous example the router was in the active state.

References

Cisco.com: Hot Standby Router Protocol Features and Functionality

Cisco.com: CISCO-HSRP-MIB

Cisco.com: CISCO-HSRP-EXT-MIB

Wikipedia: HSRP

Zabbix: a lightweight dynamic template for SNMP routers

I built the following Zabbix template to monitor small routers, with just two interfaces (WAN and LAN), which have been deployed as CPE for some customers.

What I needed was only interfaces monitoring, such as traffic, packets, status, but I needed to configure it for many etherogeneous devices, that means different SNMP indexing and naming.

I decided to build a small SNMP-based template using dynamic parameters and host macros.

Each template’s item has an SNMP OID value containing a macro reference:

Description: LAN - Description
Type: SNMPv2 agent
SNMP OID: .1.3.6.1.2.1.2.2.1.2.{$LAN_IF_IDX}
Key: ifDescr-LAN

Description: LAN - In Octets
Type: SNMPv2 agent
SNMP OID: .1.3.6.1.2.1.2.2.1.10.{$LAN_IF_IDX}
Key: ifInOctets-LAN

Description: WAN - Description
Type: SNMPv2 agent
SNMP OID: .1.3.6.1.2.1.2.2.1.2.{$WAN_IF_IDX}
Key: ifDescr-WAN

...

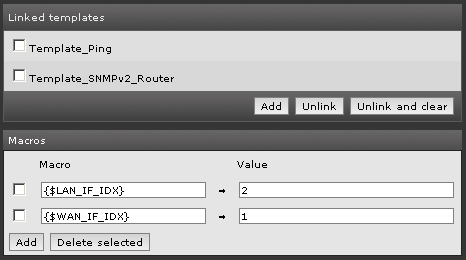
On each host you apply this template to you need to add two macros, {$LAN_IF_IDX} and {$WAN_IF_IDX}, containing the value of the LAN and WAN interface SNMP index:

In order to understand which value to use in the macro you can “ask it” to your router or run a snmpwalk on it:

CiscoRouter#show snmp mib ifmib ifindex FastEthernet 0/0
Interface = FastEthernet0/0, Ifindex = 1

root@NMS:~# snmpwalk -v 2c -c public 10.0.0.1 .1.3.6.1.2.1.2.2.1.2
iso.3.6.1.2.1.2.2.1.2.1 = STRING: "FastEthernet0/0"
iso.3.6.1.2.1.2.2.1.2.2 = STRING: "FastEthernet0/1"
iso.3.6.1.2.1.2.2.1.2.3 = STRING: "VoIP-Null0"
iso.3.6.1.2.1.2.2.1.2.4 = STRING: "Null0"
iso.3.6.1.2.1.2.2.1.2.5 = STRING: "Loopback1"

The template includes interfaces description, status, traffic (in bps and packets per second), a trigger to detect status transition and graphs.

You can find the Zabbix Template_Lightweight_Dynamic_SNMPv2_Router here; instructions about importing the template can be found on the Zabbix documentation web site.