In this post I want to show a solution based on a script (pmacct-to-elasticsearch) that I made to gather data from pmacct and visualize them using Kibana/ElasticSearch. It’s far from being the state of the art of IP accounting solutions, but it may be used as a starting point for further customizations and developments.
I plan to write another post with some ideas to integrate pmacct with the canonical ELK stack (ElasticSearch/Logstash/Kibana). As usual, add my RSS feed to your reader or follow me on Twitter to stay updated!
The big picture
This is the big picture of the proposed solution:
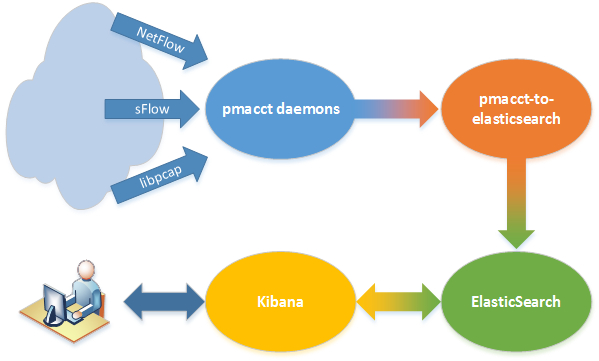
There are 4 main actors: pmacct daemons (we already saw how to install and configure them) that collect accounting data, pmacct-to-elasticsearch, which reads pmacct’s output, processes it and sends it to ElasticSearch, where data are stored and organized into indices and, at last, Kibana, that is used to chart them on a web frontend.
The starting point of this tutorial is the scenario previously viewed in the Installing pmacct on a fresh Ubuntu setup post.
UPDATE: I made some changes to the original text (that was about Kibana 4 Beta 2) since Kibana 4 has been officially released
In the first part of this post I’ll cover a simple setup of both ElasticSearch 1.4.4 and Kibana 4.
In the second part I’ll show how to integrate pmacct-to-elasticsearch with the other components.
Setup of ElasticSearch and Kibana
This is a quick guide to setup the aforementioned programs in order to have a working scenario for my goals: please strongly consider security and scalability issues before using it for a real production environment. You can find everything you need on the ElasticSearch web site.
Dependencies
Install Java (Java 8 update 20 or later, or Java 7 update 55 or later are recommended at time of writing for ElasticSearch 1.4.4):
# apt-get install openjdk-7-jre
ElasticSearch
Install ElasticSearch from its APT repository…
# wget -qO - https://packages.elasticsearch.org/GPG-KEY-elasticsearch | sudo apt-key add -
# add-apt-repository "deb http://packages.elasticsearch.org/elasticsearch/1.4/debian stable main"
# apt-get update && apt-get install elasticsearch
… and (optionally) configure it to automatically start on boot:
# update-rc.d elasticsearch defaults 95 10
Since this post covers only a simple setup, tuning and advanced configuration are out of its scope, but it is advisable to consider the official configuration guide for any production-ready setup.
Just change a network parameter to be sure that ES does not listen on any public socket; edit the /etc/elasticsearch/elasticsearch.yml file and set
network.host: 127.0.0.1
Finally, start it:
# service elasticsearch start
Wait some seconds then, if everything is ok, you can check its status with an HTTP query:
# curl http://localhost:9200/?pretty
{
  "status" : 200,
  "name" : "Wild Thing",
  "cluster_name" : "elasticsearch",
  "version" : {
    "number" : "1.4.4",
    "build_hash" : "c88f77ffc81301dfa9dfd81ca2232f09588bd512",
    "build_timestamp" : "2015-02-19T13:05:36Z",
    "build_snapshot" : false,
    "lucene_version" : "4.10.3"
  },
  "tagline" : "You Know, for Search"
}
Kibana 4
Download and install the right version of Kibana 4, depending on your architecture (here I used the x64):
# cd /opt
# curl -O https://download.elasticsearch.org/kibana/kibana/kibana-4.0.0-linux-x64.tar.gz
# tar -zxvf kibana-4.0.0-linux-x64.tar.gz
By default, Kibana listens on 0.0.0.0:5601 for the web front-end: again, for this simple setup it’s OK, but be sure to protect your server using a firewall and/or a reverse proxy like Nginx.
Run it (here I put it in background and redirect its output to /var/log/kibana4.log):
# /opt/kibana-4.0.0-linux-x64/bin/kibana > /var/log/kibana4.log &
Wait some seconds until it starts, then point your browser at http://YOUR_IP_ADDRESS:5601 to check that everything is fne.
pmacct-to-elasticsearch configuration
Now that all the programs we need are up and running we can focus on pmacct-to-elasticsearch setup.
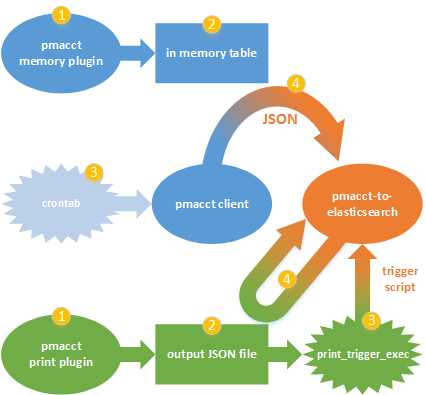
pmacct-to-elasticsearch is designed to read JSON output from pmacct daemons, to process it and to store it into ElasticSearch. It works with both memory and print plugins and, optionally, it can perform manipulations on data (such as to add fields on the basis of other values).
Install git, download the repository from GitHub and install it:
# apt-get install git
# cd /usr/local/src/
# git clone https://github.com/pierky/pmacct-to-elasticsearch.git
# cd pmacct-to-elasticsearch/
# ./install
Now it’s time to configure pmacct-to-elasticsearch to send some records to ElasticSearch. Configuration details can be found in the CONFIGURATION.md file.
In the last post an instance of pmacctd was configured, with a memory plugin named plugin1 that was performing aggregation on a socket basis (src host:port / dst host:port / protocol):
plugins: memory[plugin1]

imt_path[plugin1]: /var/spool/pmacct/plugin1.pipe
aggregate[plugin1]: etype, proto, src_host, src_port, dst_host, dst_port
In order to have pmacct-to-elasticsearch to process plugin1 output, we need to create the homonymous pmacct-to-elasticsearch configuration file, /etc/p2es/plugin1.conf; default values already point pmacct-to-elasticsearch to the local instance of ElasticSearch (URL = http://localhost:9200), so we just need to set the destination index name and type:
{
    "ES_IndexName": "example-%Y-%m-%d",
    "ES_Type": "socket"
}
Since this is a memory plugin, we also need to schedule a crontab task to consume data from the in-memory-table and pass them to pmacct-to-elasticsearch, so edit the /etc/cron.d/pmacct-to-elasticsearch file and add the line:
*/5 * * * * root pmacct -l -p /var/spool/pmacct/plugin1.pipe -s -O json -e | pmacct-to-elasticsearch plugin1
Everything is now ready to have the first records inserted into ElasticSearch: if you don’t want to wait for the crontab task to run, execute the above command from command line then query ElasticSearch to show the records:
# curl http://localhost:9200/example-`date +%F`/socket/_search?pretty
{
  ...
  "hits" : {
    "total" : 6171,
    "max_score" : 1.0,
    "hits" : [ {
      "_index" : "example-2014-12-15",
      "_type" : "socket",
      "_id" : "AUo910oSOUAYMzMu9bxU",
      "_score" : 1.0,
      "_source": { "packets": 1, "ip_dst": "172.16.1.15",
                   "@timestamp": "2014-12-15T19:32:02Z", "bytes": 256,
                   "port_dst": 56529, "etype": "800", "port_src": 53,
                   "ip_proto": "udp", "ip_src": "8.8.8.8" }
      }
      ...
    ]
  }
}
(the `date +%F` is used here to obtain the actual date in the format used by the index name, that is YYYY-MM-DD)
Just to try the configuration for a print plugin, edit the /etc/pmacct/pmacctd.conf configuration file, change the plugins line and add the rest:
plugins: memory[plugin1], print[plugin2]

print_output_file[plugin2]: /var/lib/pmacct/plugin2.json
print_output[plugin2]: json
print_trigger_exec[plugin2]: /etc/p2es/triggers/plugin2
print_refresh_time[plugin2]: 60
aggregate[plugin2]: proto, src_port
aggregate_filter[plugin2]: src portrange 0-1023
Then, prepare the p2es configuration file for pmacct-to-elasticsearch execution for this plugin (/etc/p2es/plugin2.conf):
{
    "ES_IndexName": "example-%Y-%m-%d",
    "ES_Type": "source_port",
    "InputFile": "/var/lib/pmacct/plugin2.json"
}
Here, pmacct-to-elasticsearch is instructed to read from /var/lib/pmacct/plugin2.json, the file where pmacctd daemon writes to.
As you can see from the pmacctd plugin2 configuration above, a trigger is needed in order to run pmacct-to-elasticsearch: /etc/p2es/triggers/plugin2. Just add a link to the default_trigger script and it’s done:
# cd /etc/p2es/triggers/
# ln -s default_trigger plugin2
Now you can restart pmacct daemons in order to load the new configuration for plugin2:
# service pmacct restart
or, if you preferred not to install my pmacct System V initscript:
# killall -INT pmacctd -w ; pmacctd -f /etc/pmacct/pmacctd.conf -D
After the daemon has finished writing the output file (/var/lib/pmacct/plugin2.json), it runs the trigger which, in turn, executes pmacct-to-elasticsearch with the right argument (plugin2) and detaches it.
Wait a minute, then query ElasticSearch from command line:
# curl http://localhost:9200/example-`date +%F`/source_port/_search?pretty
From now on it’s just a matter of customizations and visualization in Kibana. The official Kibana 4 Quick Start guide can help you to create visualizations and graphs. Remember, the name of the index used in these examples follows the [example-]YYYY-MM-DD daily pattern.
Housekeeping
Time series indices tend to grow and to fill up disk space and storage, so a rotation policy may be useful to delete data older than a specific date.
The Curator tool and its Delete command can help you in this:
# apt-get install python-pip
# pip install elasticsearch-curator
Once installed, test it using the right arguments…
# curator --dry-run delete indices --prefix example- --timestring %Y-%m-%d --older-than 1 --time-unit days
2014-12-15 19:04:13,026 INFO      Job starting...
2014-12-15 19:04:13,027 INFO      DRY RUN MODE.  No changes will be made.
2014-12-15 19:04:13,031 INFO      DRY RUN: Deleting indices...
2014-12-15 19:04:13,035 INFO      example-2014-12-15 is within the threshold period (1 days).
2014-12-15 19:04:13,035 INFO      DRY RUN: Speficied indices deleted.
2014-12-15 19:04:13,036 INFO      Done in 0:00:00.020131.
… and, eventually, schedule it in the pmacct-to-elasticsearch crontab file (/etc/cron.d/pmacct-to-elasticsearch), setting the desired retention period:
# m h dom mon dow user  command
...
0 1  * * *     root  curator delete indices --prefix example- --timestring \%Y-\%m-\%d --older-than 30 --time-unit days
#EOF
Of course, you can use Curator for many other management and optimization tasks too, but they are out of the scope of this post.
Latest posts by Pier Carlo Chiodi (see all)
- Good MANRS for IXPs route servers made easier - 11 December 2020
- Route server feature-rich and automatic configuration - 13 February 2017
- Large BGP Communities playground - 15 September 2016
Ciao,
mai pensato di integrare pmacct con Riemann prima di ES (così avresti la possibilità di applicare logiche applicative e notifiche di vario genere agli eventi rilevati)?
Ciao, non ho mai usato Riemann e dovrei entrare bene nell’ottica delle idee di come far sposare le due logiche; grazie per lo spunto comunque, magari un giorno avrò modo di approfondire e postare qualcosa!
Hello,
do you see a way to display the info from pmacct on a map using Kibana 4 ? pmacct can add fields with ISO country codes, but unfortunately Kibana 4 requires coordinates.
Can you try this? Displaying pmacct country code on a Kibana 4 map
Perfect, thank you !
Nice work, using Kibana with the flow data rivals commercial products.
Fantastic post, I have done some testing with this in my lab. Can you add a little more detail about why you’re using both the memory and print plugins? Wouldn’t the print plugin be sufficient on it’s own?
Thank you! I used both print and memory plugins just to show different scenarios that pmacct and p2e can manage, no technical reasons nor other purposes.
Hello Pier, It’s a very good well put tutorial. I followed it and the HOW-TO on project’s page on github, but I’m facing a problem in the integration with pmacct:
# pmacct-to-elasticsearch -t plugin1
2016-05-24 12:22:08,316 ERROR Error loading configuration from /etc/p2es/plugin1.conf
Traceback (most recent call last):
File “/usr/local/bin/pmacct-to-elasticsearch”, line 515, in Main
NewConfig = json.load( NewConfig_File )
File “/usr/lib/python2.7/json/__init__.py”, line 290, in load
**kw)
File “/usr/lib/python2.7/json/__init__.py”, line 338, in loads
return _default_decoder.decode(s)
File “/usr/lib/python2.7/json/decoder.py”, line 366, in decode
obj, end = self.raw_decode(s, idx=_w(s, 0).end())
File “/usr/lib/python2.7/json/decoder.py”, line 382, in raw_decode
obj, end = self.scan_once(s, idx)
ValueError: Expecting property name: line 5 column 2 (char 130)
P.S. I’m using print plugin.
Config file:
{
“ES_IndexName”: “netflow-%Y-%m-%d”,
“ES_Type”: “Clients”,
“InputFile”: “/home/ubuntu/plugin1.json”,
}
Hi, thank you.
Can you try to remove the “,” at the end of the 4th line?
Thanks Pier, I managed to fix it. it was just a comma 🙂
Now I have his error:
2016-05-24 15:21:04,579 ERROR Error while creating index netflow-2016-05-24 from template /etc/p2es/new-index-template.json
Traceback (most recent call last):
File “/usr/local/bin/pmacct-to-elasticsearch”, line 432, in CreateIndex
HTTPResponse = urllib2.urlopen( URL, Template )
File “/usr/lib/python2.7/urllib2.py”, line 127, in urlopen
return _opener.open(url, data, timeout)
File “/usr/lib/python2.7/urllib2.py”, line 410, in open
response = meth(req, response)
File “/usr/lib/python2.7/urllib2.py”, line 523, in http_response
‘http’, request, response, code, msg, hdrs)
File “/usr/lib/python2.7/urllib2.py”, line 448, in error
return self._call_chain(*args)
File “/usr/lib/python2.7/urllib2.py”, line 382, in _call_chain
result = func(*args)
File “/usr/lib/python2.7/urllib2.py”, line 531, in http_error_default
raise HTTPError(req.get_full_url(), code, msg, hdrs, fp)
HTTPError: HTTP Error 400: Bad Request
Thanks Pier,
I managed to find the problem and it works properly for me.
Hi!
I have the same error and can’t figure out why. Could you explain how you solved it?
Did this ever get resolved? I am getting the same and am no python expert.
Yes, I managed to solve it but unfortunately I forgot how I did that it was long time ago 🙁
and what was the problem ? thanks
Hi, Thanks for the Nice tutorial…
When i am running the cron tab command manually i get the below error.. Any idea about this error?
# pmacct -l -p /data/flows/plugin1.pipe -s -O json -e | pmacct-to-elasticsearch plugin1
pmacct: symbol lookup error: /pmacct-1.5.3/bin/pmacct: undefined symbol: json_object_update_missing
Hi, thank you.
It seems to be a pmacct issue, please have a look at the official pmacct website (http://www.pmacct.net/) and the mailing-list on it.
Thanks Pier, I got that fixed after upgrading the Jansson package to 2.6 version.
Now i am getting a different error while running the pmacct-to-elasticsearch script.
it gives the below error
ERROR Error while decoding pmacct’s JSON output: {“as_src”: 0, “iface_in”: 8, “label”: “”, “as_dst”: 0, “packets”: 1, “peer_ip_src”: “10.0.9.251”, “ip_proto”: .160.16.31″, “port_dst”: 15353, “as_src”: 0, “iface_in”: 17, “as_dst”: 0, “peer_ip_src”: “10.0.5.252”, “bytes”: 55, “iface_out”: 50, “ip_src”: “10.160.8.30”, “port_src”: 48688, “ip_proto”: “udp”, “packets”: 1}
I have the pmacct saves the json outputs via print plugin and triggers the below file:
PLUGIN_NAME=`basename $0`
/usr/local/bin/pmacct-to-elasticsearch $PLUGIN_NAME &
Below is the command it runs
ps -ef | grep python
root 6057 1 43 15:02 ? 00:00:19 python /usr/local/bin/pmacct-to-elasticsearch plugin1
cat /etc/p2es/plugin1.conf
{
“ES_IndexName”: “example-%Y-%m-%d”,
“ES_Type”: “source_port”,
“InputFile”: “/data/flows/plugin1.json”
}
pmacct-2-elasticsearch can’t parse it because, as far as it seems, the input file it uses contains bad data. The JSON blob you pasted here is actually wrong, you can test it using https://jsonformatter.curiousconcept.com/ or other validators.
I suggest you to double check the output of pmacct and to verify that every line is in correct JSON format.
Thanks Pier! Sorry to bother you again.
pmacct was not writing the json correctly so i modified the plugin to write it as CSV and i used a CSV to json converter( python script). But still i am getting the “2016-05-26 15:18:50,177 ERROR Error while decoding pmacct’s JSON output: {“SRC_PORT”: “60138”, “PEER_SRC_IP”: “10.0.5.252”, “PACKETS”: “9”, “SRC_AS”: “0”, “PROTOCOL”: “tcp”, “IN_IFACE”: “33”, “LABEL”: “”, “SRC_IP”: “103.29.32.4”, “DST_AS”: “4755”, “DST_PORT”:
” error. i searched for that line in my json output i see its in correct format.
{“SRC_PORT”: “53”, “PEER_SRC_IP”: “10.0.9.251”, “PACKETS”: “1”, “SRC_AS”: “0”, “PROTOCOL”: “udp”, “IN_IFACE”: “38”, “LABEL”: “”, “SRC_IP”: “192.158.243.3”, “DST_AS”: “0”, “DST_PORT”: “60138”, “DST_IP”: “217.163.52.9”, “OUT_IFACE”: “27”, “BYTES”: “109”}
i tried loading this in json.loads it loaded without any issue..
Am i missing anything?? i am having this installed in a VM. is it because of the performance of the server?
Sorry these are the correct outputs:
Error message:
2016-05-26 15:24:52,159 ERROR Error while decoding pmacct’s JSON output: {“SRC_PORT”: “45803”, “PEER_SRC_IP”: “10.0.9.251”, “PACKETS”: “2”, “SRC_AS”: “0”, “PROTOCOL”: “tcp”, “IN_IFACE”: “8”, “LABEL”: “”, “SRC_IP”: “10.160.3.40”, “DST_AS”:
Json file :
{“SRC_PORT”: “45803”, “PEER_SRC_IP”: “10.0.9.251”, “PACKETS”: “2”, “SRC_AS”: “0”, “PROTOCOL”: “tcp”, “IN_IFACE”: “8”, “LABEL”: “”, “SRC_IP”: “10.160.3.40”, “DST_AS”: “0”, “DST_PORT”: “80”, “DST_IP”: “10.160.17.41”, “OUT_IFACE”: “29”, “BYTES”: “194”}
What follows the “Error while decoding pmacct’s JSON output” message is the exact string that p2es tries to convert to JSON. This id done by splitting the whole input file into multiple lines: could you check that no new line occurs after the DST_AS? Also, could you send me privately a copy of that file? My contacts are at https://pierky.com/
Thanks
Pier, I found the issue.. I set the print_refresh_time:300 in pmacct but the pmacct was purging the data to disk every 60 sec instead of 300 sec. because it had print_cache_entries default value.
I increase the print_cache_entries 4 times the default one.. its no more giving the error..
Thanks for your help..
Hello pier,
Everything was working fine, then suddenly it stopped working, and I had the WARNING below. According to the source code it should be an ERROR in Json response, bur I can’t find the root cause.
2016-05-30 15:13:06,151 WARNING Bulk insert on test-2016-05-30 failed to process one or more documents
2016-05-30 15:23:21,003 WARNING Bulk insert on test-2016-05-30 failed to process one or more documents
2016-05-30 15:24:22,228 WARNING Bulk insert on test-2016-05-30 failed to process one or more documents
Hello,
it means that ElasticSearch could not process one or more records sent by p2es; this may be due to some problems on the ElasticSearch side or to issues in the data/schema mapping (for example, a string in place of a numeric field, or a date in a bad format).
The quick & dirty approach to understand which document failed is to log the entire output of p2es: you can add the following line of code after the one containing the ‘failed to process one or more documents’ error message (line 309 of the source code):
Log( logging.WARNING, Output )Be aware that, depending on your configuration, this may be a huge amount of data; you can temporary set the
ES_FlushSizeconfiguration parameter to 1 in order to have p2es to send one line at time to ElasticSearch, to have a better view of which the failing document is and what it contains.Pier,
Here is the error log. I think the problem is in timestamp field ??
2016-05-31 10:34:33,317 WARNING Bulk insert on flows-2016-05-31 failed to process one or more documents
2016-05-31 10:34:33,317 WARNING {“index”:{}}
{“ip_dst”: “54.255.154.226”, “@timestamp”: “2016-05-31T08:34:17Z”, “packets”: 2, “port_dst”: 80, “bytes”: 104, “port_src”: 37959, “ip_src”: “192.168.7.138”}
I tried to create a new index using the default template that I distribute with p2es (distrib/new-index-template.json file) and then to add the document you filed above using curl (here the official doc) and I had no problems. I tried it on a test machine running ES 2.1.0.
curl -XPUT 'http://localhost:9200/test/test_type/1' -d '{"ip_dst": "54.255.154.226", "@timestamp": "2016-05-31T08:34:17Z", "packets": 2, "port_dst": 80, "bytes": 104, "port_src": 37959, "ip_src": "192.168.7.138"}'Could you try with the same command? (replace test and test_type with your real names) Do you obtain an error message?
Pier,
I just noticed that in the housekeeping section you need to add command “indices” after “delete”:
# curator –dry-run delete indices –prefix example- –timestring %Y-%m-%d –older-than 1 –time-unit days
Oh thanks, I’ve just updated it. It was still reporting the old curator syntax, where the indices argument was missing.
What is the advantage using pmacct instead that Logstash?
Logstash has native integration with Elasticsearch and it seems very easy to configure and setup.
I’ve never analyzed LogStash deeply but AFAIK it only supports NetFlow, while pmacct supports other formats too; pmacct can also perform aggregations, transformations and filtering (also based on BGP feeds and routing info) before data are sent to its backend: maybe some of them can be done by LogStash too, I don’t know it, but I was more confortable with pmacct and it fully suited my needs.
Hi
The error trying to create an index, see earlier, may be if you use a later elasticsearch, it only supports PUT, not POST. urlib2 does not appear to work correctly, only supports POST.
Hello, it should be fixed in the dev branch on GitHub. It will be released soon. Thanks
Hi
Down loaded and reinstalled, created index ok.
Reason for using, Logstash had a unique indexing issue, and its only possibly been fixed, so I decided
to find an alternative. Looking at the geoip transform, and possibly a port-name transformer.
Hello, nice to hear that.
With regards to geoip transform, does this post work for you?
For what concerns port names, you can configure a transformation like this one, which is based on the peer IP address and interface ID:
"Transformations": [{
"Conditions": [ { "peer_ip_src": "", "__op__": "!=" }, { "iface_in": "", "__op__": "!=" } ],
"Actions": [
{ "Type": "AddField", "Name": "temporary1", "Value": "$peer_ip_src-$iface_in" },
{ "Type": "AddFieldLookup", "Name": "entry_point", "LookupFieldName": "temporary1", "LookupTableFile": "/etc/p2es/entry_point.map" },
{ "Type": "DelField", "Name": "temporary1" }
]
}
]
Then in /etc/p2es/entry_point.map you can put your port names:
{"192.168.0.10-1": "Router10 port 1",
"192.168.0.20-666": "Router20 port 666",
"*": "$peer_ip_src-$iface_in"
}
Hi
will have a look. Re the COW database, their account is suspended. I have used the free maxmind db’s in the past, will have a play.
Hii
You can also use https://onlinejsontools.org/ for json validator,beautify,minify,xml,yaml,CSV,bson,plain text,base64,tsv.
Do checkout this site!
Can you make the fields sent to ElasticSearch to be compatible with Elastiflow dashboards?
Hii
What about nfacctd,what can i do to send netflow from memory to elasticsearch please ?