Tag Archives: IP accounting

Displaying pmacct country code on a Kibana 4 map

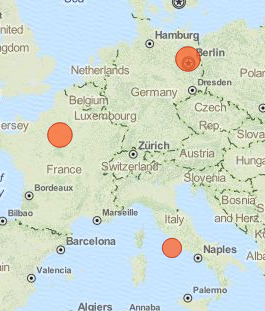
On the Integration of pmacct with ElasticSearch and Kibana post a user (Xentoo) asked how to display geographic information provided by pmacct on a Kibana 4 map using pmacct-to-elasticsearch.

An experimental feature of p2es called transformations can be used to add a Geo Point field on the basis of the country code provided by pmacct.

pmacct-to-elasticsearch-geoip

Read more …

Integration of pmacct with ElasticSearch and Kibana

In this post I want to show a solution based on a script (pmacct-to-elasticsearch) that I made to gather data from pmacct and visualize them using Kibana/ElasticSearch. It’s far from being the state of the art of IP accounting solutions, but it may be used as a starting point for further customizations and developments.

I plan to write another post with some ideas to integrate pmacct with the canonical ELK stack (ElasticSearch/Logstash/Kibana). As usual, add my RSS feed to your reader or follow me on Twitter to stay updated!

The big picture

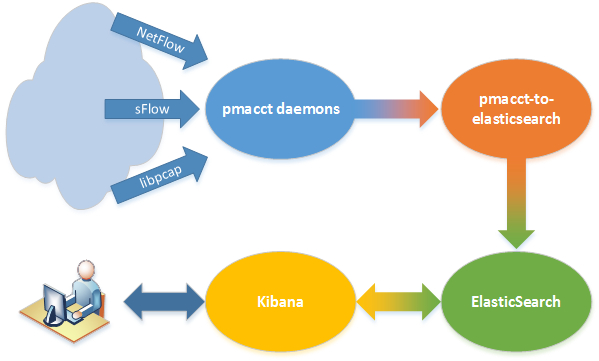
This is the big picture of the proposed solution:

pmacct-to-elasticsearch - The big picture

There are 4 main actors: pmacct daemons (we already saw how to install and configure them) that collect accounting data, pmacct-to-elasticsearch, which reads pmacct’s output, processes it and sends it to ElasticSearch, where data are stored and organized into indices and, at last, Kibana, that is used to chart them on a web frontend.

Read more …

Installing pmacct on a fresh Ubuntu setup

This is a simple, quick-and-dirty, copy/paste guide to install a great software, pmacct, on a fresh Ubuntu 14.04.1 LTS (Trusty Tahr) setup. I’ll use this simple setup as the basis for other related posts I plan to publish soon.

pmacct

Tl;dr: pmacct is a suite of tools to collect, filter and aggregate IP accounting data, which works with live traffic (libpcap), NetFlow v1/v5/v7/v8/v9, IPFIX, sFlow and ULOG.

A blog post is not enough to show the great features and possibilities that this tool offers, so I really recommend whoever may be interested to read author’s documentation on the official web site.

On a next post I plan to show some ideas to deploy pmacct together with ElasticSearch and Kibana, in order to build useful dashboards full of graphs. Add my RSS feed to your reader or follow me on Twitter to stay updated!

EDIT: the Integration of pmacct with ElasticSearch and Kibana post has been published.

Let’s start from a really simple setup here.

Read more …
NetFlow: installation and configuration of NFDUMP and NfSen on Debian

After the brief overview about the installation of flow-tools and FlowViewer, in this post I’d like to share my experience about the setup of a basic solution based on another pair of tools: NFDUMP and NfSen. As always on my posts, the starting point is a fresh Debian 5.0 setup.

UPDATE: you may be interested in FlowGraph too, a tool that allows to dynamically build graphs based on previously collected netflow data and to use them in a web-based front-end, adding details about Autonomous System Number holders, IPv4 and IPv6 prefixes, inet(6)num objects, netnames from RIPE Stat.

Read more …

NetFlow: weird TCP flags in FlowViewer and flow-print?

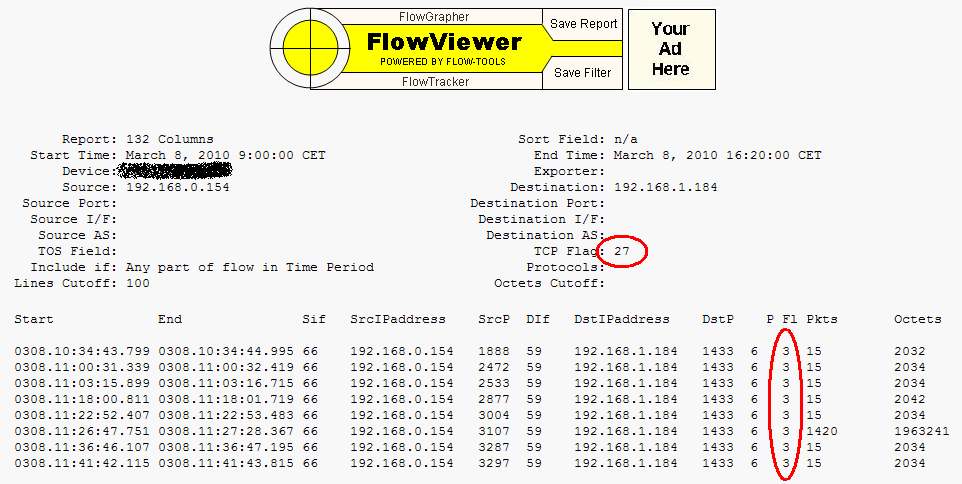
Working with FlowViewer and flow-print (from the flow-tools suite), if you filter some NetFlow data by TCP flags you may notice a weird behaviour, like the one in the following picture:

FlowViewer - TCP Flags

Here I applied a filter on TCP Flags = 27, but on the output I had the “Fl” (Flag) column reporting 3! What’s up? Is 3 a kind of alias for 27? Is this a math puzzle? None of this!

Read more …